At a glance
Key figures (IFRS) Galapagos Group |
|||||||
|
|
|
|
||||
(thousands of €, if not stated otherwise) |
31/12/2015 |
31/12/2014 |
31/12/2013 |
||||
|
|||||||
Results1 |
|
|
|
||||
Revenues and other income |
60,579 |
90,021 |
96,572 |
||||
R&D expenditure |
(129,714) |
(111,110) |
(99,380) |
||||
S, G&A expenses |
(20,308) |
(14,867) |
(13,817) |
||||
Restructuring and integration costs |
– |
(669) |
(290) |
||||
Personnel expenses (including share-based compensation) |
(47,034) |
(38,447) |
(35,979) |
||||
Capital expenditure |
6,665 |
2,804 |
8,168 |
||||
Depreciation and amortization of (in)tangible assets |
(3,402) |
(3,765) |
(4,105) |
||||
EBIT |
(89,444) |
(36,624) |
(16,915) |
||||
EBITDA |
(86,042) |
(32,859) |
(12,810) |
||||
Net loss from continuing operations |
(118,410) |
(37,303) |
(16,811) |
||||
Net income from discontinued operations |
– |
70,514 |
8,732 |
||||
Net income / loss (–) |
(118,410) |
33,211 |
(8,079) |
||||
Balance sheet |
|
|
|
||||
Total assets |
442,514 |
270,467 |
287,374 |
||||
Cash, cash equivalents and restricted cash |
348,216 |
198,440 |
141,481 |
||||
Total liabilities |
77,515 |
64,332 |
120,237 |
||||
Stockholders' equity |
364,999 |
206,135 |
167,137 |
||||
Equity ratio (in %) |
82% |
76% |
58% |
||||
Galapagos share |
|
|
|
||||
Number of shares issued on 31 December |
39,076,342 |
30,299,129 |
29,794,046 |
||||
Basic and diluted income / loss (–) per share (in €) |
(3.32) |
1.10 |
(0.28) |
||||
Share price on 31 December (in €) |
56.76 |
15.49 |
15.30 |
||||
Personnel data |
|
|
|
||||
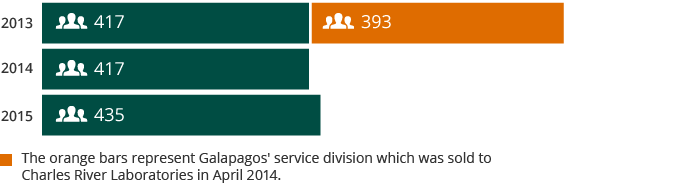
Total Group employees on 31 December (number) |
435 |
417 |
8102 |
||||
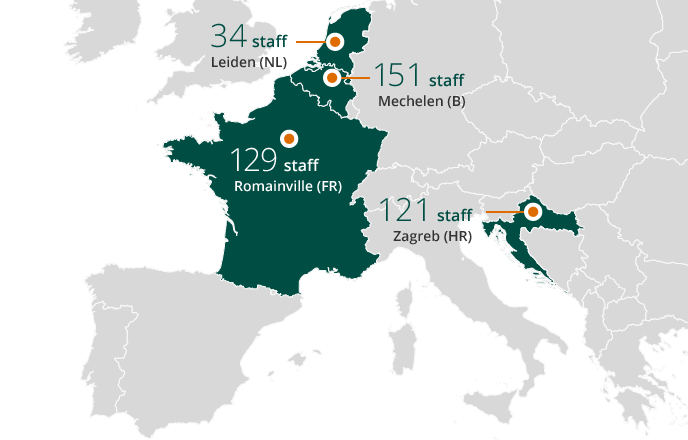
Employees per site

Number of employees