At a glance
(thousands of €, if not stated otherwise) |
30/09/2015 |
30/09/2014 |
||
|
||||
Results1 |
|
|
||
Revenues and other income |
47,219 |
62,675 |
||
R&D expenditure |
(96,873) |
(77,200) |
||
S, G&A expenses |
(13,600) |
(10,812) |
||
Restructuring and integration costs |
– |
(594) |
||
Personnel expenses (including share-based compensation) |
(34,053) |
(29,241) |
||
Capital expenditure |
4,543 |
4,233 |
||
Depreciation and amortization of (in)tangible assets |
2,518 |
2,823 |
||
EBIT |
(63,254) |
(25,931) |
||
EBITDA |
(65,773) |
(28,754) |
||
Net loss from continuing operations |
(61,406) |
(27,005) |
||
Net income from discontinued operations |
– |
70,514 |
||
Net income / loss (–) |
(61,406) |
43,509 |
||
Galapagos share |
|
|
||
Number of shares issued on 30 September |
39,012,842 |
30,292,604 |
||
Basic and diluted loss per share from continuing operations (in €) |
(1.78) |
(0.89) |
||
Dividend (in €) |
– |
– |
||
Share price on 30 September (in €) |
36.54 |
11.98 |
||
Personnel data |
|
|
||
Total Group employees on 30 September (Number) |
427 |
417 |
||
(thousands of €, if not stated otherwise) |
30/09/2015 |
31/12/2014 |
Total assets |
461,049 |
270,467 |
Cash, cash equivalents and restricted cash |
374,447 |
198,440 |
Total liabilities |
42,258 |
64,332 |
Stockholders’ equity |
418,791 |
206,135 |
Equity ratio (in %) |
91% |
76% |
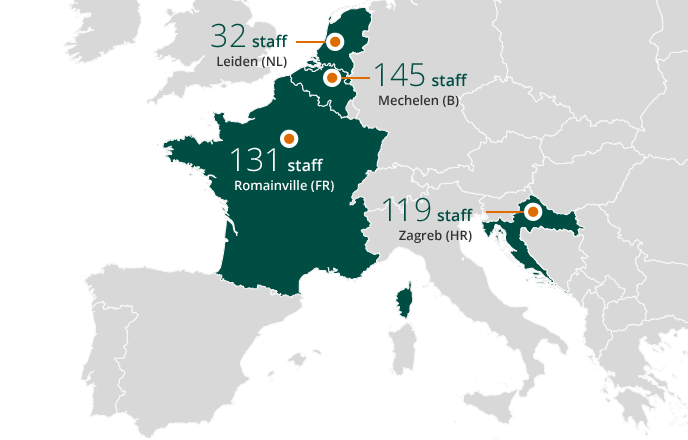
Employees per site as of 30 September 2015